line-of-balance
Many types of projects contain repeated blocks of activities. Examples of these kinds of projects include road and high-rise construction. In both of these types of projects there is a set of tasks repeated across many work areas. Arrow and Precedence Diagramming are both able to model these types of schedules effectively. The Line-of-Balance (also known as the Vertical Production Method) is a graphical technique that can be used in conjunction with Arrow or Precedence Diagrams.
In the Line-of-Balance diagram, the x-axis represents (as in the bar chart) the timeline of the project. The y-axis identifies the work areas that define the project. The blank chart below is the starting point for the Line-of-Balance schedule.
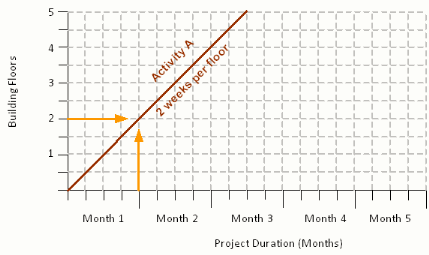
As crews arrive on the project, they begin at the first work area and move through the project. In the figure below, Activity A has a total duration of 10 weeks. Spread across each of the work areas the productivity of Activity A can be shown to be 2 weeks per floor.
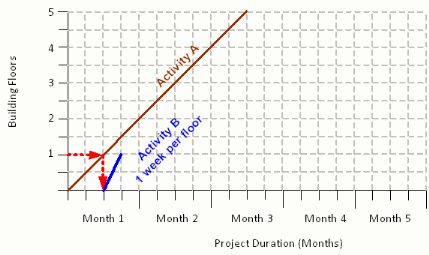
Now consider the implication of an Activity B that has a productivity of one week per floor. If we try to start Activity B as soon as possible, then the start of activity B on the first floor can occur at the end of week 2.
As we continue to add Activity B throughout the remaining work areas we can see that Activity B starts on the second floor, at the end of week 4; on the third floor, at the end of week 6 and so on; as shown in the diagram below.
As you look at this chart, what do you think the red dashed lines mean?
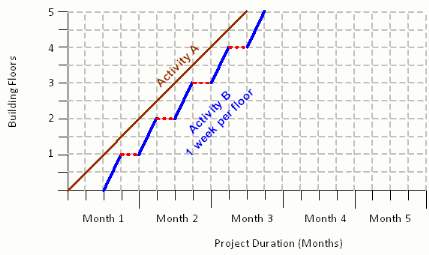
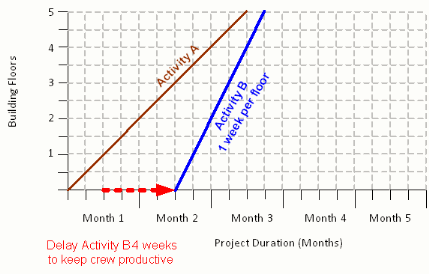
The breaks in the Activity B line, shown as red dashed lines above, are significant. This gap means that the crew is waiting around for Activity A to clear out before it can start. In the case of the project above, starting work as soon as you can will result in a lost productivity of 4 crew weeks.
The diagram below shows that you should delay starting Activity B for four weeks. If you do that, then you will keep the crew productive for their entire stay on your project. If you were running a real project, you might include a bit extra time in case things backup, but you would likely not start Activity B as soon as it could start!
Use of graphical methods, such as the Line-of-Balance method result in a common understanding of how crews follow one another through the job work areas. Such an immediate, intuitive understanding of the project is often not possible with the output provided by commonly used software products.
A key conclusion for you to remember regardless of what computer program you use, if you dont understand what its doing to your projects crew productivities, you will not be able to control costs on your projects.
As a result the Line-of-Balance diagram is an essential communication and productivity analysis tool for projects that have repetitive work areas.